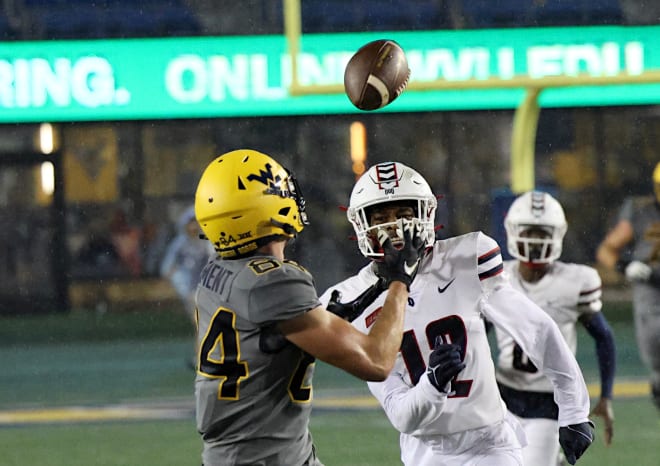
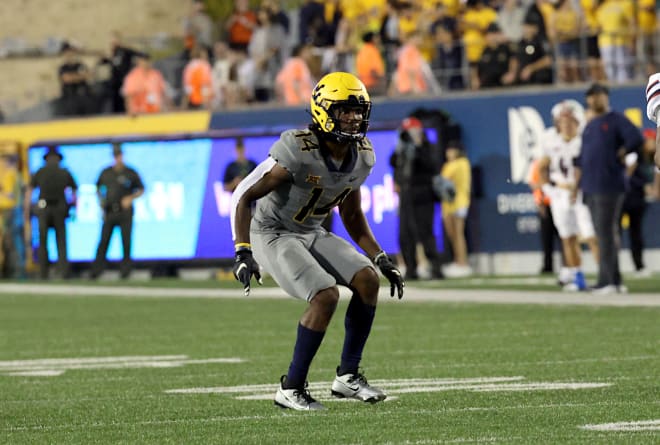
PFF: Grades from West Virginia vs. Duquesne
WVSports.com and the Rivals network has teamed up with PFF, the go-to site for player grades and advanced analytics in both college football and the NFL. We will incorporate PFF data into stories regularly going forward, and one thing you can look forward to each week is a grade for all of West Virginia's players from the previous game by their scale.
In this article, we use the PFF grades to show you how the Mountaineers performed during their matchup against Duquesne.
You can find information on how the grade system works below.
OFFENSE:

| Player | Position | Grade |
|---|---|---|
|
Garrett Greene |
QB |
90.5 |
|
Wyatt Milum |
LT |
85.6 |
|
Landen Livingston |
C |
85.0 |
|
Brandon Yates |
RG |
82.4 |
|
Hudson Clement |
RWR |
82.2 |
|
Doug Nester |
RT |
80.5 |
|
Jahiem White |
HB |
78.2 |
|
Nicco Marchiol |
QB |
77.2 |
|
C.J. Cole |
RWR |
76.2 |
|
Tomas Rimac |
LG |
74.4 |
|
Johnny Williams IV |
RT |
74.1 |
|
Kole Taylor |
TE-R |
73.2 |
|
Jaylen Anderson |
HB |
72.6 |
|
Bryce Biggs |
LG |
71.9 |
|
Zach Frazier |
C |
69.1 |
|
Preston Fox |
SLWR |
67.9 |
|
Sullivan Weidman |
RG |
66.6 |
|
Nick Malone |
LT |
65.8 |
|
Ja'Quay Hubbard |
RG |
63.8 |
|
CJ Donaldson Jr. |
HB |
63.5 |
|
Ja'Shaun Poke |
RWR |
62.1 |
|
Colin McBee* |
FB |
59.8 |
|
Luke Hamilton* |
FB |
58.9 |
|
Victor Wikstrom |
TE-L |
57.3 |
|
Treylan Davis |
TE-L |
56.8 |
|
Tyler Evans* |
LWR |
56.7 |
|
DJ Oliver |
HB |
56.3 |
|
Will Dixon* |
TE-R |
55.3 |
|
Jarel Williams* |
SLWR |
54.9 |
|
Noah Massey* |
SLWR |
54.8 |
|
Cortez Braham |
LWR |
53.4 |
|
Rodney Gallagher III |
SLWR |
50.7 |
|
Jeremiah Aaron |
LWR |
47.0 |
West Virginia's offense vs. Duquesne defense

| Team | Position Group | Grade |
|---|---|---|
|
West Virginia |
Passing Offense |
89.3 |
|
Receiver/Pass Routes |
65.9 |
|
|
Duquesne |
Coverage |
61.0 |

| Team | Position Group | Grade |
|---|---|---|
|
West Virginia |
Rushing Offense |
74.2 |
|
Duquesne |
Rushing Defense |
50.9 |

| Team | Position Group | Grade |
|---|---|---|
|
West Virginia |
Pass Blocking |
90.8 |
|
Run Blocking |
82.0 |
|
|
Duquesne |
Pass Rush |
55.1 |
|
Rush Defense |
50.9 |
DEFENSE:

| Player | Position | Grade |
|---|---|---|
|
Fatorma Mulbah* |
NT |
92.8 |
|
Taurus Simmons |
ROLB |
91.2 |
|
Malachi Ruffin |
LCB |
83.5 |
|
Beanie Bishop Jr. |
RCB |
82.0 |
|
Trey Lathan |
MLB |
75.9 |
|
Zeiqui Lawton* |
DRE |
75.8 |
|
Hershey McLaurin |
WLB |
74.3 |
|
Jared Bartlett |
ROLB |
74.3 |
|
Mike Lockhart |
NT |
72.4 |
|
Lee Kpogba |
MLB |
70.9 |
|
Oryend Fisher* |
DLT |
70.1 |
|
Christion Stokes* |
SS |
69.9 |
|
Jacolby Spells |
LCB |
69.2 |
|
Tyrin Bradley |
LOLB |
67.2 |
|
Hammond Russell IV* |
NT |
662. |
|
Jairo Faverus |
WLB |
66.0 |
|
Aubrey Burks |
FS |
65.9 |
|
Sean Martin |
LE |
64.9 |
|
Josiah Jackson* |
RCB |
63.5 |
|
Anthony Wilson |
SS |
62.5 |
|
Lance Dixon |
WLB |
62.3 |
|
Harry Hilvert* |
NT |
61.9 |
|
Davoan Hawkins |
RE |
61.3 |
|
Caden Biser* |
LILB |
61.1 |
|
DJ Cotton* |
DRT |
60.5 |
|
Corey McIntyre Jr. |
DRE |
60.5 |
|
Derek Berlitz* |
DLT |
60.2 |
|
Raleigh Collins III* |
SCB |
60.2 |
|
James Heard Jr.* |
LOLB |
60.2 |
|
Aden Tagaloa-Neslon* |
FS |
60.0 |
|
Jordan Jackson* |
RCB |
60.0 |
|
Avery Wilcox |
FS |
58.8 |
|
Edward Vesterinen |
DRT |
57.9 |
|
Jalen Thornton |
LE |
56.6 |
|
Tomiwa Durojaiye |
DRE |
54.1 |
|
Ben Cutter |
RILB |
53.7 |
|
Keyshawn Cobb |
SS |
53.1 |
|
Andrew Wilson-Lamp |
RCB |
39.1 |

| Team | Position Group | Grade |
|---|---|---|
|
Duquesne |
Passing Offense |
73.1 |
|
Receiver/Pass Routes |
66.3 |
|
|
West Virginia |
Coverage |
70.4 |

| Team | Position Group | Grade |
|---|---|---|
|
Duquesne |
Rushing Offense |
53.2 |
|
West Virginia |
Rushing Defense |
84.1 |

| Team | Position Group | Grade |
|---|---|---|
|
Duquesne |
Pass Blocking |
23.5 |
|
Run Blocking |
58.4 |
|
|
West Virginia |
Pass Rush |
84.4 |
|
Rush Defense |
84.1 |
On every play, a PFF analyst will grade each player on a scale of -2 to +2 according to what he did on the play.
At one end of the scale you have a catastrophic game-ending interception or pick-six from a quarterback, and at the other a perfect deep bomb into a tight window in a critical game situation, with the middle of that scale being 0-graded, or ‘expected’ plays that are neither positive nor negative.
Each game is also graded by a second PFF analyst independent of the first, and those grades are compared by a third, Senior Analyst, who rules on any differences between the two. These grades are verified by the Pro Coach Network, a group of former and current NFL coaches with over 700 combined years of NFL coaching experience, to get them as accurate as they can be.
From there, the grades are normalized to better account for game situation; this ranges from where a player lined up to the dropback depth of the quarterback or the length of time he had the ball in his hand and everything in between. They are finally converted to a 0-100 scale and appear in our Player Grades Tool.
Season-level grades aren’t simply an average of every game-grade a player compiles over a season, but rather factor in the duration at which a player performed at that level. Achieving a grade of 90.0 in a game once is impressive, doing it (12) times in a row is more impressive.
It is entirely possible that a player will have a season grade higher than any individual single-game grade he achieved, because playing well for an extended period of time is harder to do than for a short period, Similarly, playing badly for a long time is a greater problem than playing badly once, so the grade can also be compounded negatively.
Each week, grades are subject to change while we run through our extensive review process including All-22 tape runs and coaching audit, so you may notice discrepancies among grades published in earlier articles compared with those in the Player Grades tool until grade lock each week.
----------
• Talk about it with West Virginia fans on The Blue Lot.
• SUBSCRIBE today to stay up on the latest on Mountaineer sports and recruiting.
• Get all of our WVU videos on YouTube by subscribing to the WVSports.com Channel
• Follow us on Twitter: @WVSportsDotCom, @rivalskeenan
•Like us on Facebook


