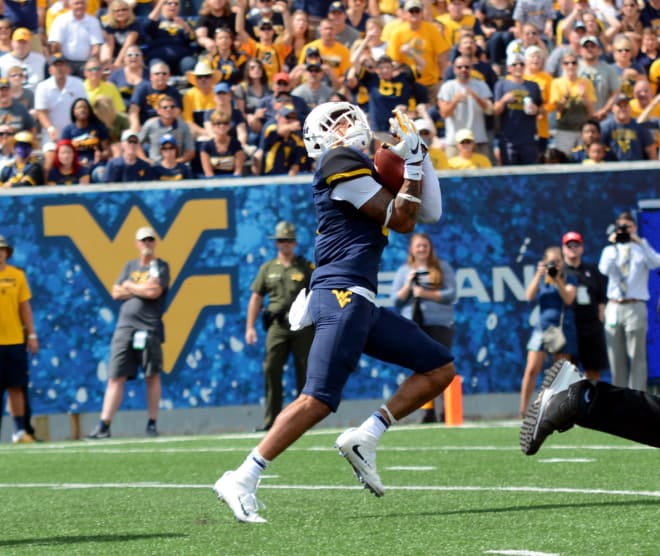
WVU improves statistically during out of conference games over 2016

On Saturday West Virginia completed the out-of-conference portion of their 2017 schedule. From a statistical standpoint the Mountaineers have improved in many offensive, defensive and special teams categories over the 2016 out-of-conference season.
The Mountaineer offense is averaging 50 yards more per game over last season and an impressive 13.3 points per game year over year.
Third down conversion was a strength of the 2016 squad early as they were at 51% but this year that number is down to 38%.
The WVU offense has only two interceptions this season as opposed to four last year.
Ball security will need to be focus going forward. West Virginia has fumbled the ball five times thus far and lost two of those. At this point last year the team had also lost two fumbles and had only put it on the carpet twice.
| Catagory | 2016 | 2017 |
|---|---|---|
|
Passing Yardage |
324.7 |
369.3 |
|
Rushing Yardage |
208.3 |
213.7 |
|
Total Offense |
533.0 |
583.0 |
|
Scoring Offense |
33.00 |
46.3 |
On defense the total yards allowed has decreased almost 50 yards per game but opponents are scoring on average one additional point per contest.
The West Virginia defense is holding teams to only 27% on their third down conversions, that's second in the Big 12. In 2016 the OOC teams were picking up third downs at 47%.
This season the Mountaineer defense has four sacks for a loss of 32 yards. Last year in the OOC portion the defense only collected two sacks for a loss of 15 yards.
| Catagory | 2016 | 2017 |
|---|---|---|
|
Opponent Passing Yardage |
247.7 |
234.3 |
|
Opponent Rushing Yardage |
215.0 |
179.0 |
|
Opponent Total Defense |
462.7 |
413.3 |
|
Scoring Defense |
21.3 |
22.3 |
Every Mountaineer fan has aware of the recent struggles on special teams. While kickoff average has improved the punt return average continues to underwhelm at only 4.0 yards per return.
WVU has allowed less yards on kickoff returns. In 2016 the unit allowed 23.9 to out-of-conference opponents but this season the number is down to 20.1 per return.
On punt return defense the Mountaineers are allowing only 5.0 yards per return this year, down from 9.75 in 2016.
| Catagory | 2016 | 2017 |
|---|---|---|
|
Kick Return Average |
22.1 |
31.4 |
|
Punt Return Average |
4.0 |
4.0 |
|
Net Punting Average |
37.3 |
39.2 |
NOTES
WVU's Sagarin strength of schedule is currently at No. 160 in the country, last season at this point it was No. 36.
In the national rankings the Mountaineers are No. 6 in total offense, up from No. 13 last season.
Out of conference West Virginia led Big 12 teams in time of possession (30:33) last year. This year the team is ninth in the conference at 26:30.
In 2016 WVU had 14 out-conference penalties for an average of 44 per yards game, this season there have been 19 penalties for a per game average of 65.3 yards.
Entering conference play in 2016 West Virginia was ranked 29th in the AP Top 25 poll and 30th in the USA Today Coaches Poll. This season the Mountaineers are ranked 26th in both polls.

